# Feature Scores
## Walkthrough: PETS in a few cells
This opening section runs end-to-end on a small slice of the fastai
Oxford-IIIT Pet dataset so you can see concrete numeric outputs before
reading the API reference below.
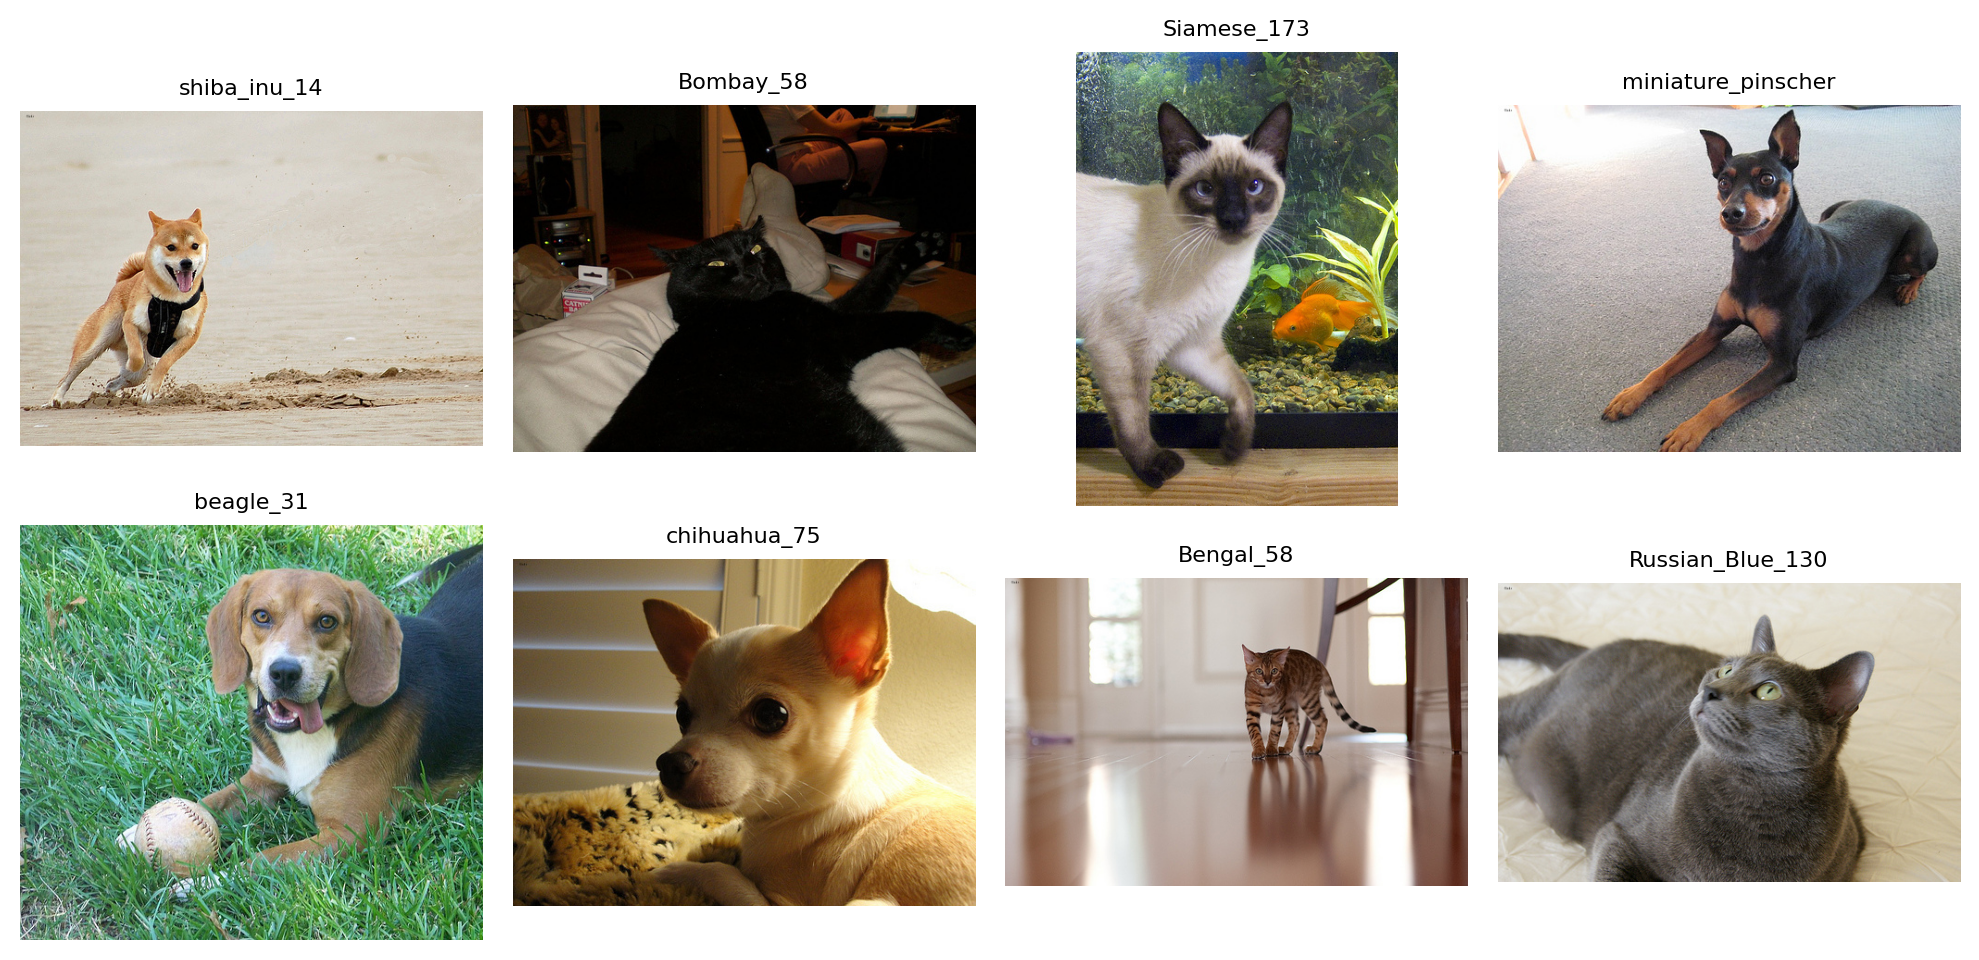
Only the first 8 images returned by `get_image_files` are used so the
documentation remains quick to generate. The goal is not to analyze the
full dataset here, but to show real `compute_feature_score_table` output
on disk files.
``` python
from pathlib import Path
from fastai.vision.all import URLs, get_image_files, untar_data
from PIL import Image
import matplotlib.pyplot as plt
```
``` python
# Import a dataset (example: fastai PETS).
pets_path = untar_data(URLs.PETS) / "images"
pet_images = list(get_image_files(pets_path))[:8]
```
``` python
len(pet_images), [path.name for path in pet_images]
```
(8,
['shiba_inu_14.jpg',
'Bombay_58.jpg',
'Siamese_173.jpg',
'miniature_pinscher_4.jpg',
'beagle_31.jpg',
'chihuahua_75.jpg',
'Bengal_58.jpg',
'Russian_Blue_130.jpg'])
``` python
# Uses the installed package so this walkthrough can appear before the `#| export` cells.
import tell_me_why.feature_scores as _fs
pets_scores = _fs.compute_feature_score_table(
pet_images,
score_names=[
"brightness",
"variance",
"redness_dominance",
"symmetry_error",
"fft_high_frequency_ratio",
],
on_error="raise",
)
pets_scores_display = pets_scores.copy()
pets_scores_display["image_name"] = pets_scores_display["Source_File_Path"].map(lambda path: Path(path).name)
pets_scores_display = pets_scores_display.drop(columns="Source_File_Path")
pets_scores_display = pets_scores_display[["image_name", *[col for col in pets_scores_display.columns if col != "image_name"]]]
pets_scores_display.round(4)
```
Computing brightness: 0%| | 0/8 [00:00
|
image_name |
brightness |
variance |
redness_dominance |
symmetry_error |
fft_high_frequency_ratio |
| 0 |
shiba_inu_14.jpg |
0.7555 |
0.0176 |
0.5491 |
0.0889 |
0.5315 |
| 1 |
Bombay_58.jpg |
0.1711 |
0.0477 |
0.7016 |
0.1534 |
0.4465 |
| 2 |
Siamese_173.jpg |
0.4284 |
0.0479 |
0.5613 |
0.2105 |
0.5394 |
| 3 |
miniature_pinscher_4.jpg |
0.5688 |
0.0625 |
0.5165 |
0.2563 |
0.4899 |
| 4 |
beagle_31.jpg |
0.4799 |
0.0355 |
0.4072 |
0.2172 |
0.6502 |
| 5 |
chihuahua_75.jpg |
0.4795 |
0.0594 |
0.7384 |
0.2793 |
0.4448 |
| 6 |
Bengal_58.jpg |
0.6254 |
0.0477 |
0.5762 |
0.2379 |
0.4307 |
| 7 |
Russian_Blue_130.jpg |
0.5452 |
0.0665 |
0.5519 |
0.1784 |
0.4253 |
``` python
fig, axes = plt.subplots(2, 4, figsize=(10, 5))
for ax, image_path in zip(axes.flat, pet_images):
ax.imshow(Image.open(image_path))
ax.set_title(image_path.stem[:18], fontsize=8)
ax.axis("off")
plt.tight_layout()
```
 The values obtained here are not interpreted as model explanations. They
are used to verify that each score family produces a numeric measurement
on real images:
- `brightness` and `variance` describe global intensity;
- `redness_dominance` comes from the color family;
- `symmetry_error` comes from the spatial family;
- `fft_high_frequency_ratio` comes from the frequency family.
The sections below document every helper behind this table, including
`map_learner_predictions` for aligning paths with fastai learner
outputs.
## Mapping Learner Outputs
Before comparing feature scores with model predictions, the alignment
between learner outputs and the original files must be preserved. The
following function keeps the order produced by
`get_preds(..., reorder=False)` and reconstructs a provenance table.
------------------------------------------------------------------------
### map_learner_predictions
``` python
def map_learner_predictions(
learn:Any, # Learner whose dataloaders expose the original dataset items.
ds_idxs:Sequence[int]=(0, 1), # Dataset indices to map. In fastai, 0 is usually train and 1 is valid.
include_predictions:bool=False, # When True, append target and prediction columns to the provenance table.
): # Concatenated inputs and a DataFrame aligned row-by-row with these inputs.
```
*Map fastai learner predictions back to their source files.*
## Global Intensity Scores
These scores summarize the grayscale distribution across the whole
image. They are useful for detecting brightness, contrast, or
statistical asymmetry effects that can influence a binary classifier
without directly corresponding to semantic structure.
------------------------------------------------------------------------
### compute_skewness_scores
``` python
def compute_skewness_scores(
image_paths:Iterable[ImagePath], on_error:ErrorPolicy='previous'
)->list[float]:
```
*Compute grayscale skewness for each image.*
------------------------------------------------------------------------
### compute_variance_scores
``` python
def compute_variance_scores(
image_paths:Iterable[ImagePath], on_error:ErrorPolicy='previous'
)->list[float]:
```
*Compute grayscale variance as a global contrast score.*
------------------------------------------------------------------------
### compute_brightness_scores
``` python
def compute_brightness_scores(
image_paths:Iterable[ImagePath], on_error:ErrorPolicy='previous'
)->list[float]:
```
*Compute mean grayscale intensity for each image.*
## Color Scores
These scores use the RGB channels. They should be interpreted carefully:
they can capture dataset, lighting, makeup, or preprocessing effects as
much as cues that are truly related to the class.
------------------------------------------------------------------------
### compute_redness_dominance_scores
``` python
def compute_redness_dominance_scores(
image_paths:Iterable[ImagePath], on_error:ErrorPolicy='previous'
)->list[float]:
```
*Compute red-channel dominance relative to green and blue channels.*
------------------------------------------------------------------------
### compute_color_covariance_scores
``` python
def compute_color_covariance_scores(
image_paths:Iterable[ImagePath], on_error:ErrorPolicy='previous'
)->list[float]:
```
*Compute covariance between red and blue channels.*
## Spatial and Regional Scores
These scores preserve positional information: left-right symmetry,
top/bottom ratio, central texture, eye-band contrast, and edge activity
in the jaw region. They are closer to visual hypotheses about faces, so
they are less generic than global scores.
------------------------------------------------------------------------
### compute_jaw_texture_scores
``` python
def compute_jaw_texture_scores(
image_paths:Iterable[ImagePath], on_error:ErrorPolicy='previous'
)->list[float]:
```
*Compute lower-face edge activity from adjacent-pixel intensity
differences.*
------------------------------------------------------------------------
### compute_eye_region_contrast_scores
``` python
def compute_eye_region_contrast_scores(
image_paths:Iterable[ImagePath], on_error:ErrorPolicy='previous'
)->list[float]:
```
*Compute grayscale variance in a horizontal band roughly matching the
eye region.*
------------------------------------------------------------------------
### compute_center_texture_scores
``` python
def compute_center_texture_scores(
image_paths:Iterable[ImagePath], on_error:ErrorPolicy='previous'
)->list[float]:
```
*Compute grayscale variance in the central crop of each image.*
------------------------------------------------------------------------
### compute_top_bottom_ratio_scores
``` python
def compute_top_bottom_ratio_scores(
image_paths:Iterable[ImagePath], on_error:ErrorPolicy='previous'
)->list[float]:
```
*Compute mean brightness ratio between upper and lower halves.*
------------------------------------------------------------------------
### compute_symmetry_scores
``` python
def compute_symmetry_scores(
image_paths:Iterable[ImagePath], on_error:ErrorPolicy='previous'
)->list[float]:
```
*Compute horizontal symmetry error. Lower values mean stronger
symmetry.*
## Frequency Scores and Thresholds
Frequency scores move into the Fourier domain to measure the proportion
of energy carried by high frequencies. The Otsu helper remains separate:
it does not directly produce a dataset score, but can be used to build
scores based on segmentation or foreground/background separation.
------------------------------------------------------------------------
### find_otsu_threshold
``` python
def find_otsu_threshold(
im_gray:Tensor
)->int:
```
*Find Otsu’s threshold for a grayscale image tensor.*
Accepts images scaled either in `[0, 1]` or `[0, 255]`.
------------------------------------------------------------------------
### compute_fft_scores
``` python
def compute_fft_scores(
image_paths:Iterable[ImagePath], radius:int=30, image_size:tuple[int, int]=(200, 200),
on_error:ErrorPolicy='previous'
)->list[float]:
```
*Compute the high-frequency energy ratio for each image.*
The central disk of radius `radius` is treated as low frequency. The
score is the remaining high-frequency energy divided by total FFT
magnitude energy.
## Exported Catalog
The registry below provides a common API for listing available scores or
computing a complete table. Keys remain in English for the Python API,
while the notebook sections document the intent of each category.
------------------------------------------------------------------------
### compute_feature_score_table
``` python
def compute_feature_score_table(
image_paths:Iterable[ImagePath], # Images to score.
score_names:Sequence[str] | None=None, # Names from `available_feature_scores()`. When omitted, all scores are computed.
on_error:ErrorPolicy='previous', # Error handling policy for unreadable images.
):
```
*Compute selected feature scores and return them in a pandas DataFrame.*
------------------------------------------------------------------------
### available_feature_scores
``` python
def available_feature_scores(
)->dict[str, list[str]]:
```
*Return available feature-score names grouped by category.*
The values obtained here are not interpreted as model explanations. They
are used to verify that each score family produces a numeric measurement
on real images:
- `brightness` and `variance` describe global intensity;
- `redness_dominance` comes from the color family;
- `symmetry_error` comes from the spatial family;
- `fft_high_frequency_ratio` comes from the frequency family.
The sections below document every helper behind this table, including
`map_learner_predictions` for aligning paths with fastai learner
outputs.
## Mapping Learner Outputs
Before comparing feature scores with model predictions, the alignment
between learner outputs and the original files must be preserved. The
following function keeps the order produced by
`get_preds(..., reorder=False)` and reconstructs a provenance table.
------------------------------------------------------------------------
### map_learner_predictions
``` python
def map_learner_predictions(
learn:Any, # Learner whose dataloaders expose the original dataset items.
ds_idxs:Sequence[int]=(0, 1), # Dataset indices to map. In fastai, 0 is usually train and 1 is valid.
include_predictions:bool=False, # When True, append target and prediction columns to the provenance table.
): # Concatenated inputs and a DataFrame aligned row-by-row with these inputs.
```
*Map fastai learner predictions back to their source files.*
## Global Intensity Scores
These scores summarize the grayscale distribution across the whole
image. They are useful for detecting brightness, contrast, or
statistical asymmetry effects that can influence a binary classifier
without directly corresponding to semantic structure.
------------------------------------------------------------------------
### compute_skewness_scores
``` python
def compute_skewness_scores(
image_paths:Iterable[ImagePath], on_error:ErrorPolicy='previous'
)->list[float]:
```
*Compute grayscale skewness for each image.*
------------------------------------------------------------------------
### compute_variance_scores
``` python
def compute_variance_scores(
image_paths:Iterable[ImagePath], on_error:ErrorPolicy='previous'
)->list[float]:
```
*Compute grayscale variance as a global contrast score.*
------------------------------------------------------------------------
### compute_brightness_scores
``` python
def compute_brightness_scores(
image_paths:Iterable[ImagePath], on_error:ErrorPolicy='previous'
)->list[float]:
```
*Compute mean grayscale intensity for each image.*
## Color Scores
These scores use the RGB channels. They should be interpreted carefully:
they can capture dataset, lighting, makeup, or preprocessing effects as
much as cues that are truly related to the class.
------------------------------------------------------------------------
### compute_redness_dominance_scores
``` python
def compute_redness_dominance_scores(
image_paths:Iterable[ImagePath], on_error:ErrorPolicy='previous'
)->list[float]:
```
*Compute red-channel dominance relative to green and blue channels.*
------------------------------------------------------------------------
### compute_color_covariance_scores
``` python
def compute_color_covariance_scores(
image_paths:Iterable[ImagePath], on_error:ErrorPolicy='previous'
)->list[float]:
```
*Compute covariance between red and blue channels.*
## Spatial and Regional Scores
These scores preserve positional information: left-right symmetry,
top/bottom ratio, central texture, eye-band contrast, and edge activity
in the jaw region. They are closer to visual hypotheses about faces, so
they are less generic than global scores.
------------------------------------------------------------------------
### compute_jaw_texture_scores
``` python
def compute_jaw_texture_scores(
image_paths:Iterable[ImagePath], on_error:ErrorPolicy='previous'
)->list[float]:
```
*Compute lower-face edge activity from adjacent-pixel intensity
differences.*
------------------------------------------------------------------------
### compute_eye_region_contrast_scores
``` python
def compute_eye_region_contrast_scores(
image_paths:Iterable[ImagePath], on_error:ErrorPolicy='previous'
)->list[float]:
```
*Compute grayscale variance in a horizontal band roughly matching the
eye region.*
------------------------------------------------------------------------
### compute_center_texture_scores
``` python
def compute_center_texture_scores(
image_paths:Iterable[ImagePath], on_error:ErrorPolicy='previous'
)->list[float]:
```
*Compute grayscale variance in the central crop of each image.*
------------------------------------------------------------------------
### compute_top_bottom_ratio_scores
``` python
def compute_top_bottom_ratio_scores(
image_paths:Iterable[ImagePath], on_error:ErrorPolicy='previous'
)->list[float]:
```
*Compute mean brightness ratio between upper and lower halves.*
------------------------------------------------------------------------
### compute_symmetry_scores
``` python
def compute_symmetry_scores(
image_paths:Iterable[ImagePath], on_error:ErrorPolicy='previous'
)->list[float]:
```
*Compute horizontal symmetry error. Lower values mean stronger
symmetry.*
## Frequency Scores and Thresholds
Frequency scores move into the Fourier domain to measure the proportion
of energy carried by high frequencies. The Otsu helper remains separate:
it does not directly produce a dataset score, but can be used to build
scores based on segmentation or foreground/background separation.
------------------------------------------------------------------------
### find_otsu_threshold
``` python
def find_otsu_threshold(
im_gray:Tensor
)->int:
```
*Find Otsu’s threshold for a grayscale image tensor.*
Accepts images scaled either in `[0, 1]` or `[0, 255]`.
------------------------------------------------------------------------
### compute_fft_scores
``` python
def compute_fft_scores(
image_paths:Iterable[ImagePath], radius:int=30, image_size:tuple[int, int]=(200, 200),
on_error:ErrorPolicy='previous'
)->list[float]:
```
*Compute the high-frequency energy ratio for each image.*
The central disk of radius `radius` is treated as low frequency. The
score is the remaining high-frequency energy divided by total FFT
magnitude energy.
## Exported Catalog
The registry below provides a common API for listing available scores or
computing a complete table. Keys remain in English for the Python API,
while the notebook sections document the intent of each category.
------------------------------------------------------------------------
### compute_feature_score_table
``` python
def compute_feature_score_table(
image_paths:Iterable[ImagePath], # Images to score.
score_names:Sequence[str] | None=None, # Names from `available_feature_scores()`. When omitted, all scores are computed.
on_error:ErrorPolicy='previous', # Error handling policy for unreadable images.
):
```
*Compute selected feature scores and return them in a pandas DataFrame.*
------------------------------------------------------------------------
### available_feature_scores
``` python
def available_feature_scores(
)->dict[str, list[str]]:
```
*Return available feature-score names grouped by category.*